|
Script:
RTTc Mickey MA
 Back to Catalogue Back to Catalogue
Purpose
:
Chart version of an Entry Script scanning for retracement based on the 2-day count-back method.
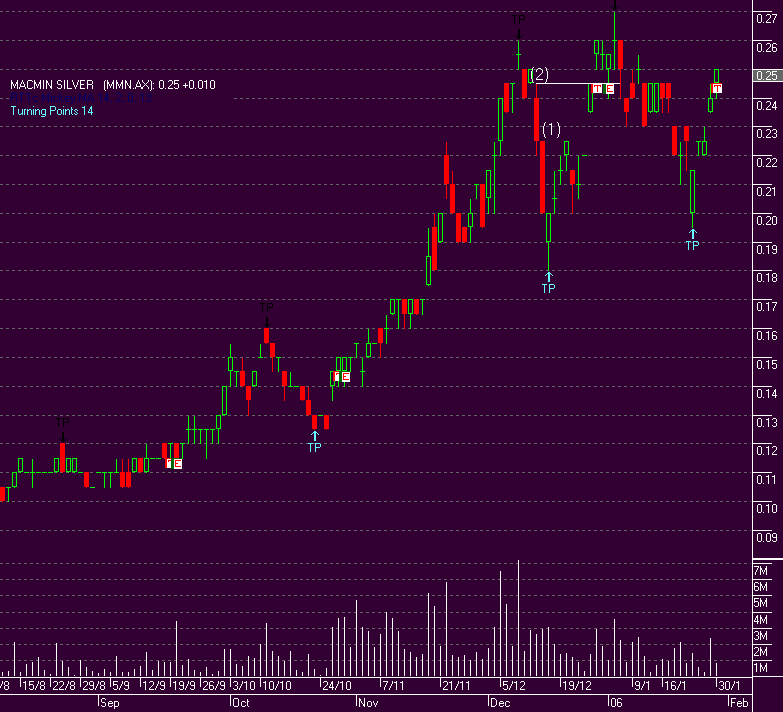
It draws two different icons -
 first day the Close hits the trigger level first day the Close hits the trigger level
 first day the price drops below the trigger level. first day the price drops below the trigger level.
The two icons appear independent of each other; their upper edge marks the trigger level.
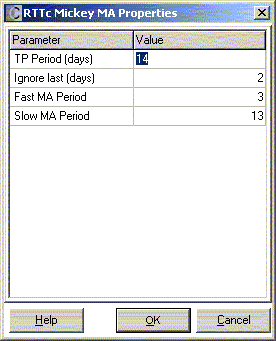
If the two MA periods (see parameters) are specified, the markers are drawn only if the price trend is rising. A rising trend is assumed if the fast EMA is moving above the slow EMA; both EMAs are calculated from the "typical" price.
(For details, see calculation of Pivot Level at RTT PivotsY.)
Setting either MA period to 0 (zero) will deactivate this option.
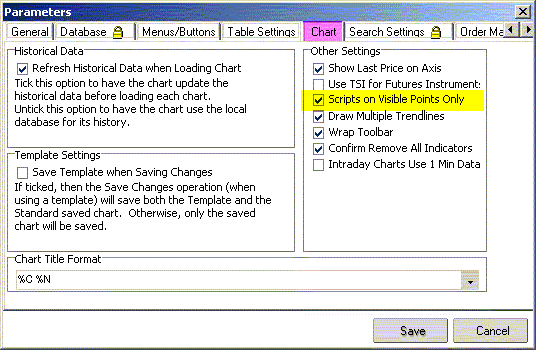
To save time, it is recommended to set the global chart parameters to "calculate visible points only". This means the script calculates and draws only for the days visible in the current window. (see "Parameters" below)
If you zoom out and wish to expand the plot, right-click inside the window, select the script's Properties, and click "OK". That will redraw the plot for the larger time frame.
Please note that plotted scripts work on any time scale. Substitute "tick" (week, hour, month...) for "day" where appropriate.
 Back to Catalogue Back to Catalogue
References:
2-day countback
MDS Pre-Alert Turning Point
 Back to Catalogue Back to Catalogue
Parameters:
TP Period = period, over which the Turningpoint is determined
Ignore last = minimum distance between TP and possible Trigger day
Fast MA Period,
Slow MA Period = EMA periods; set to zero to skip trend test.

Global (File) Parameter Setting for Chart to draw plotted scripts faster:

 Back to Catalogue Back to Catalogue
Example: BHP

Example: MMN

Back to Catalogue
|


